Indexing all environmental information on an H3 vector grid
Project description
The goal is to build a decision support system based on geographic and environmental data: wildfires, land cover, administrative boundaries, drought indicators, light pollution, and more. The data is indexed on an H3 grid for fine-grained spatial analysis. Processing is carried out with Python algorithms and the datamarts are generated with DBT, a SQL generator based on Jinja templates.
Our project stands out from standard business intelligence projects through its ability to integrate geographic and environmental data, to perform fine-grained spatial analysis thanks to H3 indexing, and to stay flexible enough to meet specific needs.
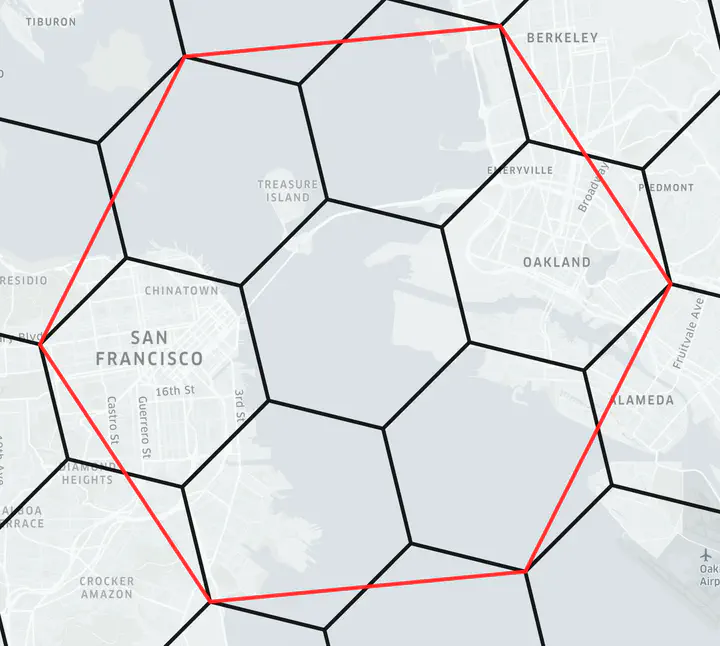
H3 is a hexagonal spatial indexing system developed by Uber that divides the Earth’s surface into a grid of hexagons of variable sizes. It is particularly useful for fine-grained spatial analysis of data, as it allows data to be stored at different levels of granularity.
The advantages of using H3 over a standard geographic information system are numerous:
- It adapts the fineness of the spatial analysis, since data can be stored at different levels of spatial granularity.
- It is also more efficient in terms of data storage, as it can store data of different sizes in a single grid.
- It works easily with visualization tools such as geographic dashboards, giving users a better understanding of the data.
Using H3, we can better understand the risks related to wildfires, drought and light pollution. H3 indexing enables fine-grained spatial analysis, meaning we can identify the areas most affected by drought or light pollution with greater accuracy.
DBT is a key tool for our project because it lets us generate datamarts from our data. It uses Jinja templates to generate SQL queries that can be used to build geographic dashboards and automated reports. This gives users a better understanding of the data and enables more effective decision-making.
In short, our project is based on geographic and environmental data, fine-grained spatial analysis through H3 indexing, and flexibility to meet specific needs, using DBT to generate datamarts, geographic dashboards and automated reports.
Skills used and deliverables
- Python
- Data Visualisation
- Data Management