Large-scale environmental geoprocessing and spatial analysis
What does Bilbo mean?
Bilbo stands for Business Intelligence for Land and Biodiversity Observation. It is a research and development project aimed at developing indicators for Earth observation.
Project objective
The environmental observatory’s goal is to translate the state, pressures and responses affecting the environment in New Caledonia. To meet these objectives, we collect and analyze environmental monitoring data produced locally by local authorities, mining companies, research institutes, associations and businesses, as well as data produced worldwide, such as that obtained from Earth observation satellites:
- land cover and erosion,
- wildfires,
- vegetation drought indicators,
- the light pollution indicator
- …
The amount of information to be analyzed is massive and constantly growing — this is Big Data. To optimize our productivity in monitoring, we aim to automate processing and the publication of information in a decision-ready format.
Main challenges
Heavy, time-consuming geoprocessing
Spatial relationships
In a classic (non-spatial) BI project, the added value comes from crossing data in a model structured by relationships between information: reference keys. In our case, the relationship between information is ALSO spatial, and this specificity implies heavier calculations than key-based relationships.
From GIS to a decision support system
The approach we have followed so far consists of transposing the model of a Geographic Information System into a Decision Support System, which means defining which facts and which dimensions will allow us to answer all our questions.
The facts
Our first results led to the production of data made up of the results of geographic intersections between environmental pressures (burned areas, for example), context information (land cover types) and administrative perimeter information (municipal boundaries). The result of these divisions constitutes our DataWareHouse, which provides aggregated results according to our temporal, thematic and above all spatial dimensions.
This model is not fully satisfactory because it multiplies the crossings performed for each of the themes analyzed. Databases are weighed down by redundant information, notably due to the inclusive nature of the data depending on the scales studied (a region encompasses +/- several municipalities). Moreover, the heterogeneity of the precision of the data we cross sometimes leads to a patchwork of objects producing geometric invalidities or semantic inconsistencies.
The DataMarts (DTM)
These are the tables resulting from the aggregation of facts according to the chosen dimensions. These tables are then used to produce reports, maps and statistical analyses. They are produced by SQL scripts and stored in a relational database. The SQL scripts are redundant, so the use of the DBT framework brings an improvement in terms of maintainability and readability of the scripts.
Towards a more efficient approach
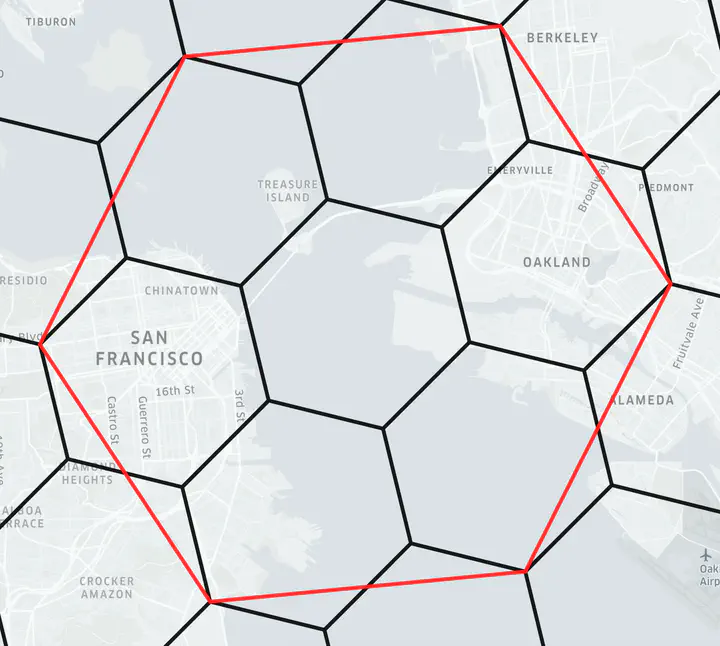
The side effects of our current approach led me to think about a more efficient, more robust and more flexible approach: the use of a lightweight spatial index that optimizes spatial relationship calculations. The following article presents this approach: